Before Instagram, Spotify and GroupMe, there were postcards, cassette tapes and operators.
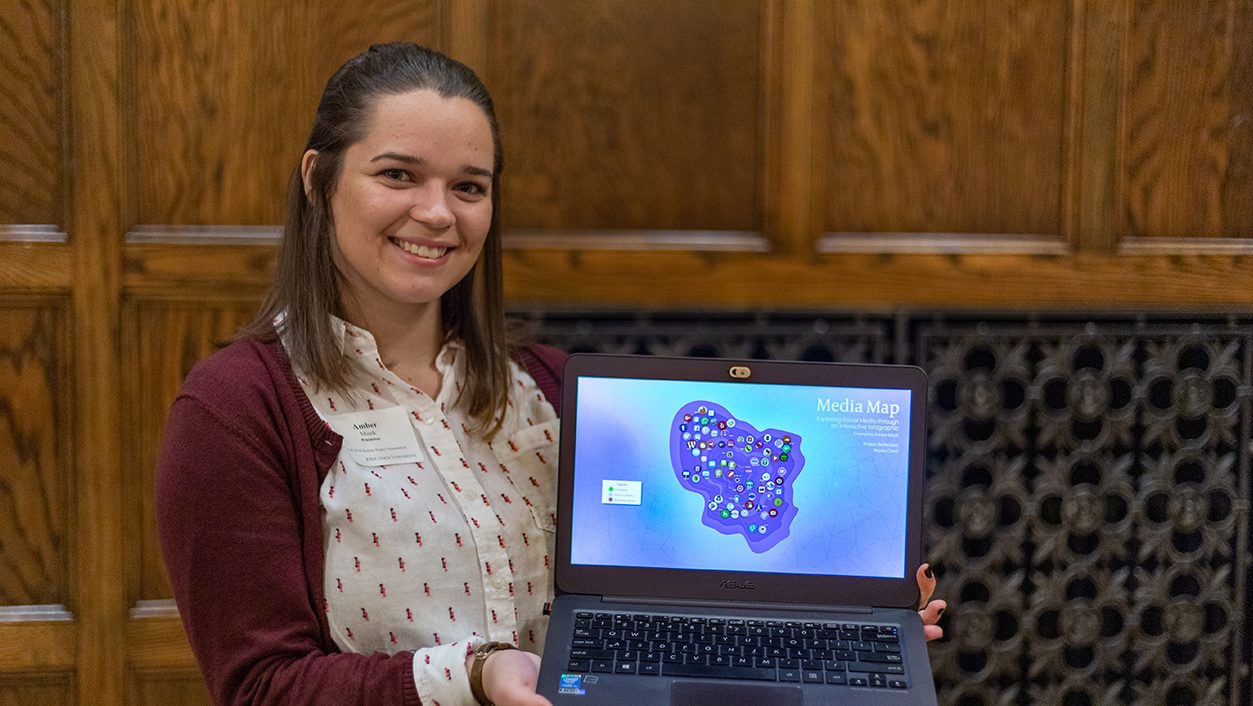
A new media map infographic by Greenlee student Amber Misek illustrates how media has evolved over time to meet society’s needs.
Misek, a graduating senior in public relations and psychology, explored how technological advances have changed the way people communicate through the years as part of her Iowa State university senior honors project.
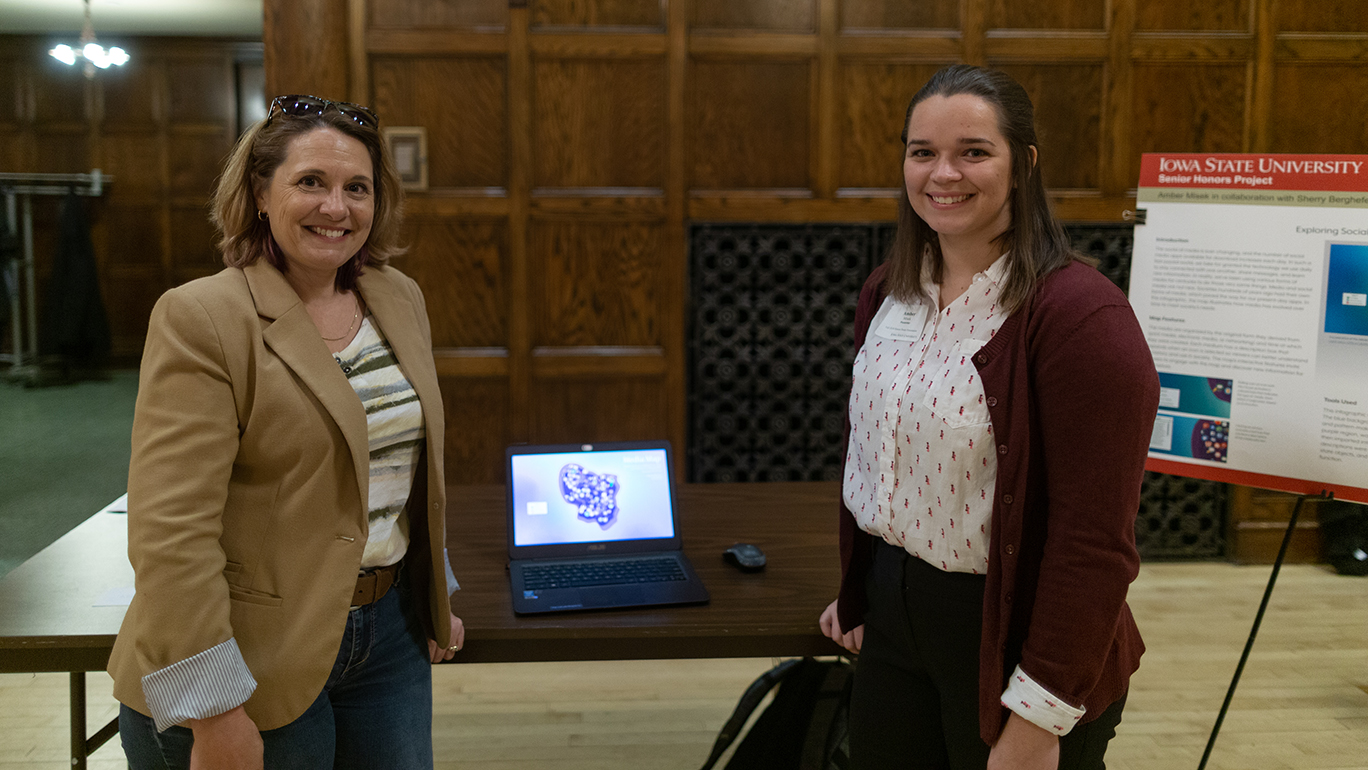
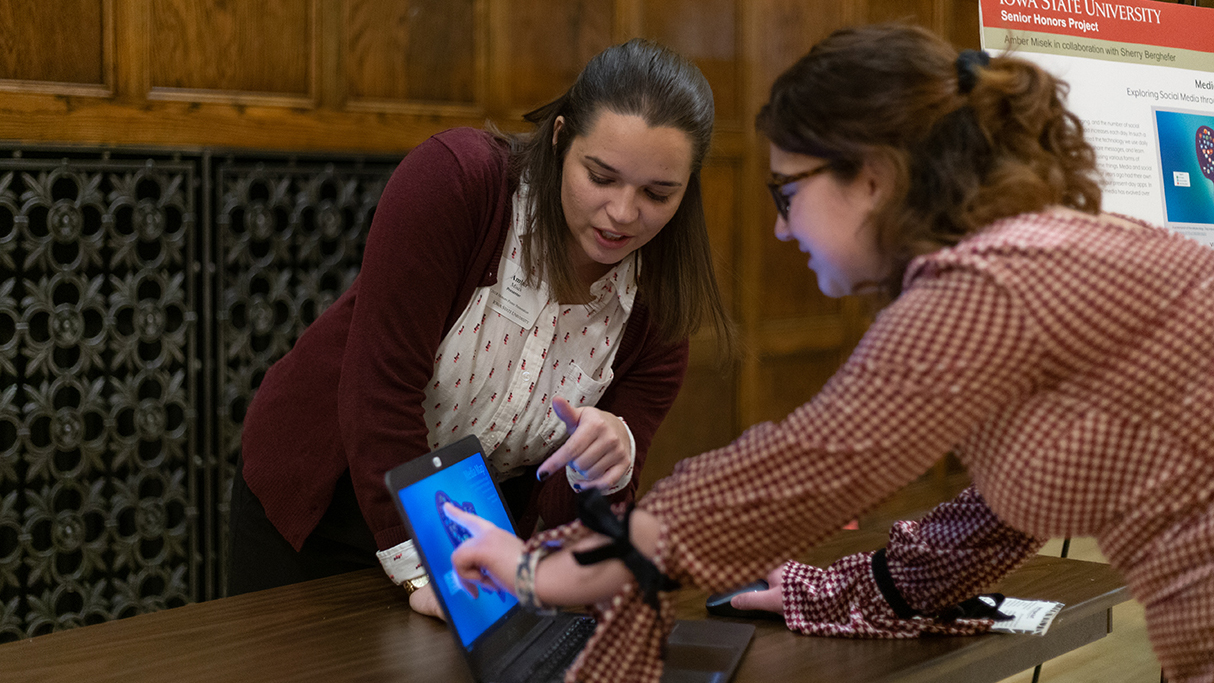
Working with Greenlee Senior Lecturer Sherry Berghefer, Misek, chose to showcase her research in an interactive map that illustrates her findings and provides an engaging experience for the viewer.
“With Amber’s combined interest in both creating visuals and data, an interactive infographic seemed a natural fit. A history of social media would be pretty dry and hard to follow as just text. By using this format, she was able to fit a lot of information into a finite space, while still allowing viewers to control how much information they receive,” Berghefer said.
Misek was inspired by existing social media infographics that show how popular media apps are used by consumers. However, she wanted to build on that idea by showing not only how social media platforms are used, but also how they grew from preexisting media over time.
Icons are organized both by purpose and a general timeline in which they were introduced in relation to one another.
Each medium has a description box that expands when an icon is selected to provide more info about its history and use in society. Misek made the infographic using Adobe Indesign and Illustrator.
“In working on this project, I realized how big of an impact technology has on how we connect and communicate with one another. It contrasts the idea that technology makes humans less social, because in reality, we’re using new technology to reach more people in more ways. This has been happening for centuries, and I think it’s important to remember that while technology shapes our lives, it doesn’t limit our ability to be human,” Misek said.
View Misek’s Media Map.